Where do people with disabilities live in Australia?
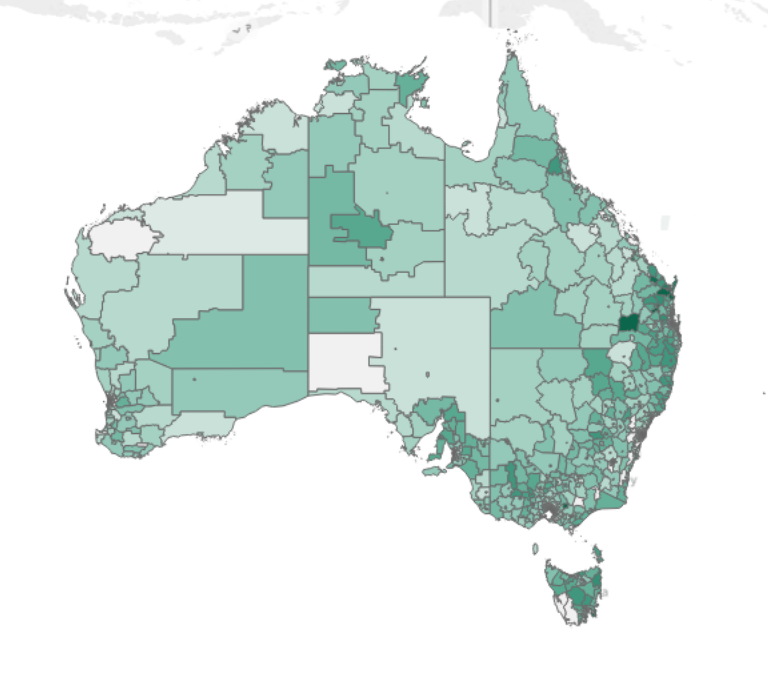
When 23 million Australians filled in their Census forms in 2016, 3.3% of working age adults (15 to 64 years) were identified as having a disability as they reported needing assistance in their self care, mobility and communication in their daily living.
Our team at the Centre of Research Excellence in Disability and Health has released an interactive online map, and an accompanying Technical Report.
The map shows the proportion of working age adults who were identified as having a disability across Australia. It shows that there is considerable variation in the prevalence of disability between small geographic areas.
People can access this map below and explore specific geographic areas of interest through the built-in navigating functions.
The accompanying Technical Report documents some key decisions on the map specifications. The Report also covers topics on data and definition, selection of geographic unit, impact of small counts, missing values, age standardisation, and data stability over time. It also gives a series of snapshots of several regions across the country where very high proportions of working age adults resided.
NOTE: The geographic areas used in the map are the Statistical Area Level 2 (SA2) as defined in Australian Statistical Geography Standard (ASGS) by the Australian Bureau of Statistics (ABS). The SA2 is the smallest area used in the majority of ABS statistical releases and generally have a population range of 3,000 to 25,000 persons. On average, they contain about 6,600 working age adults.
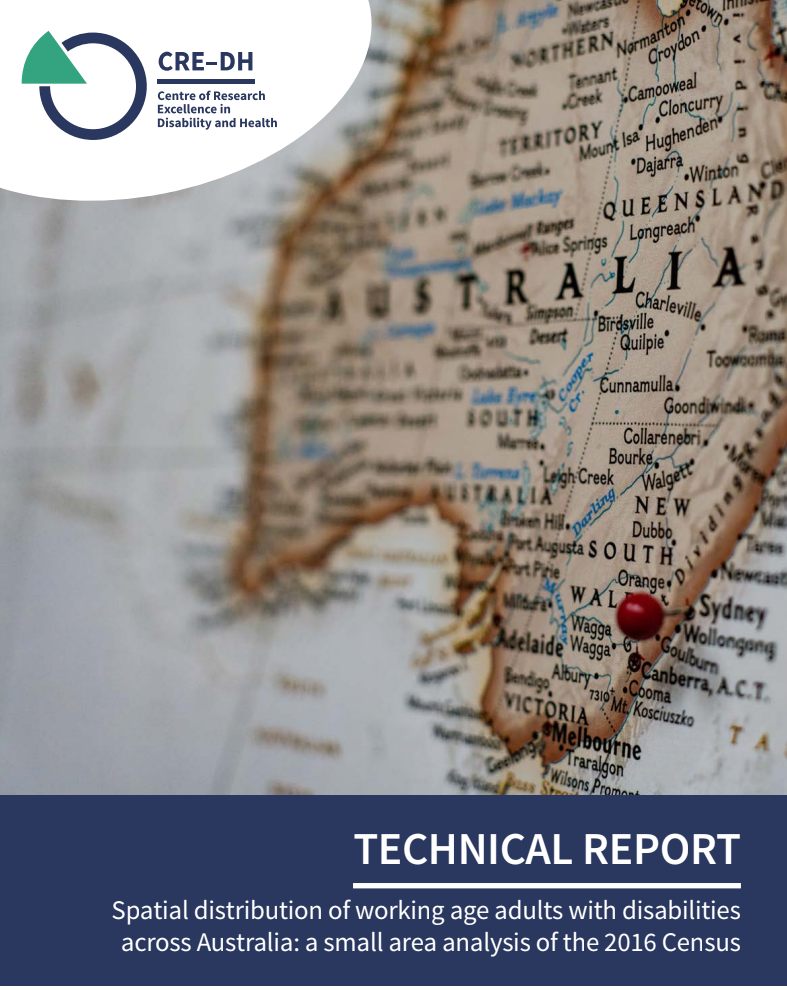
The full report is called Spatial distribution of adults with disabilities in Australia: A small area analysis of the 2016 Census, Centre of Research Excellence in Disability and Health, May 2018.
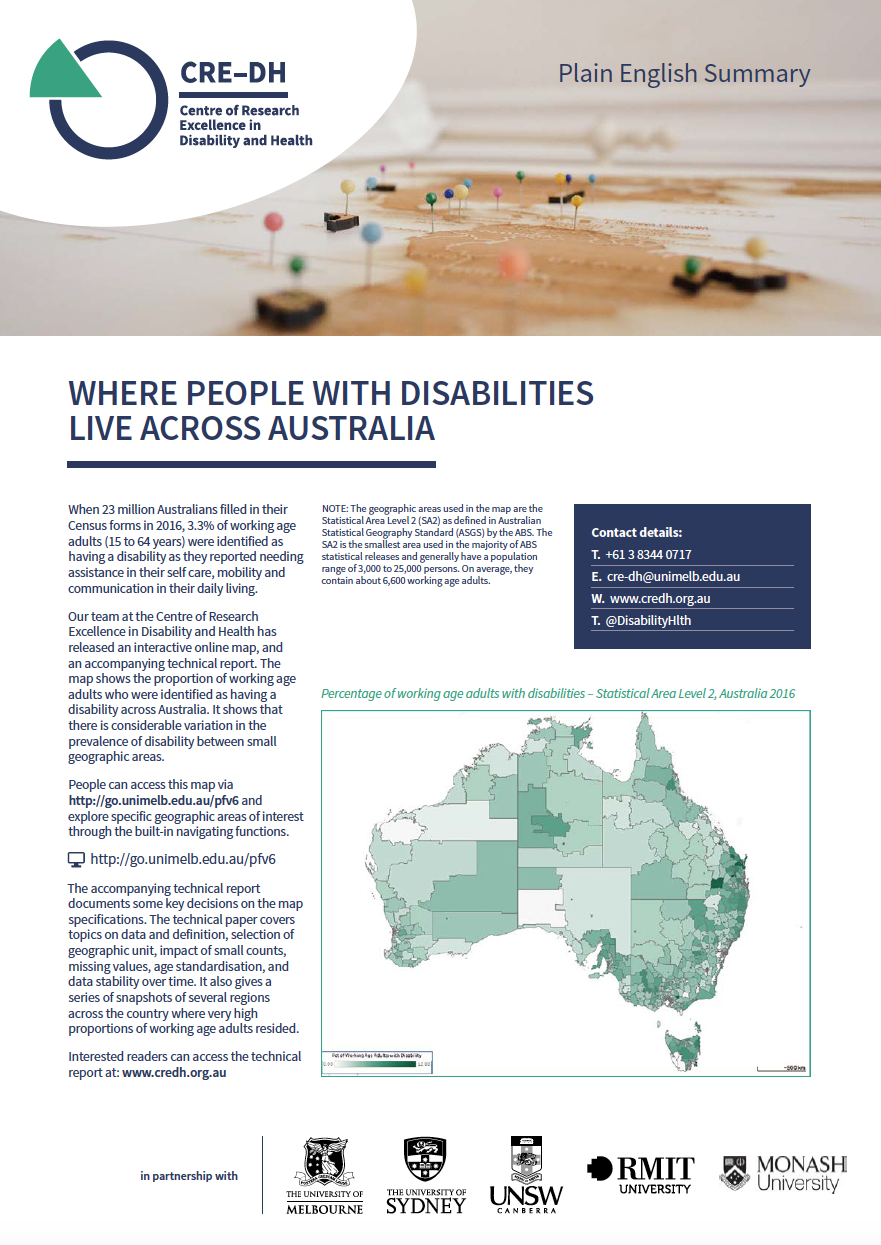
The Plain English summary can be downloaded (pdf version) below


